
Unleashing the Power of Geospatial Analytics with Geobase and MotherDuck
By Geobase TeamPublished Mar 26, 2024
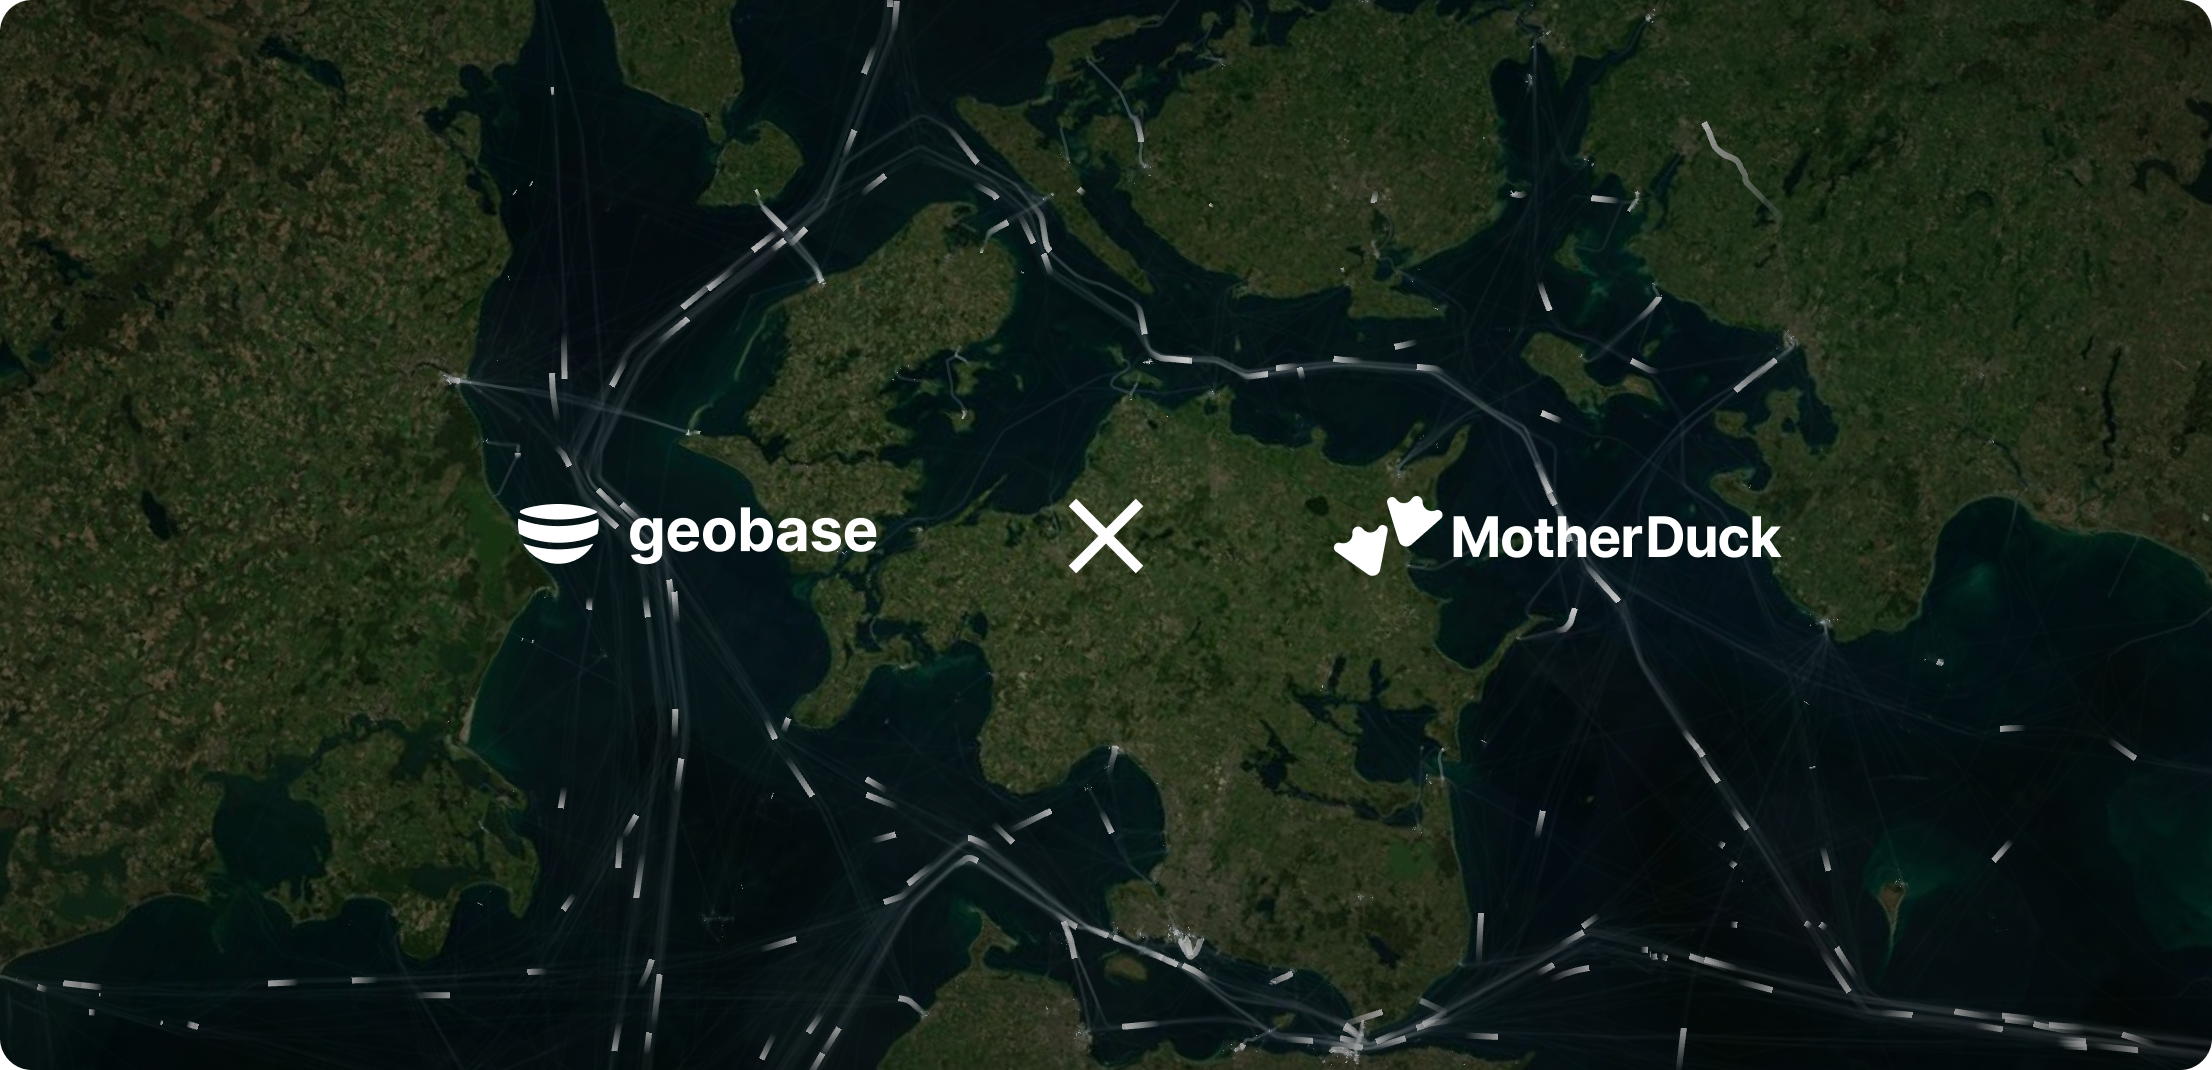
In this post, we will show how Geobase and MotherDuck can work together to create previously impossible applications! MotherDuck handles online analytical processing (OLAP) queries efficiently, while Geobase excels at spatial-temporal queries for movement analytics. With this integration, all API calls are routed through Geobase, enabling stored procedures to generate vector tiles on the frontend seamlessly.
Skagerrak & Kattegat — The Region's Importance in World Trade and Shipping
Over 80% of the volume of international trade in goods is carried by sea. For Western Europe, most of this volume passes through the Danish Straits. Like road transport networks, this trade moves from the main trade routes to ports, and from there into channels and rivers.
This region is also home to some of the largest offshore energy farms, such as the Lillgrund Wind Farm. It also hosts major engineering projects like the Oresund Bridge.
The raw data of ship traffic in this region of international waters is available on the Danish Maritime Authority’s website as monthly CSV extracts. We wanted to use Geobase and MotherDuck to bring this data to life!
Once the data was visualized, we started to discover things we never knew existed, like maintenance ships working at the offshore wind farm from 7 AM to 3 PM (see video here) or the preference of ship captains to take certain routes over others (see video here). These are all very human stories hidden in the data.
The site is now live for everyone to discover more patterns and stories in the data at Ship Tracks.

So how did MotherDuck and Geobase help us build this?
This visualization shows the movement of around 5000 ships over a 24-hour period in the Danish Straits. This would be pretty hard to do without some of the features Geobase offers.
Geobase can connect to MotherDuck databases, and you can use stored procedures to generate vector tiles on the frontend. The figure above shows how the integration of MotherDuck and the Geobase platform functions.

MotherDuck (DuckDB):
Geobase Platform:
Vector Tiles API:
Applications:
| Feature | Geobase | MotherDuck |
| Type | Backend-as-a-Service (BaaS) | Big-Data-as-a-Service |
| Primary Function | Full stack applications development for spatial-temporal data | Host and scale DuckDB databases |
| Strength | Spatial-temporal queries, H3 integration, point cloud, and fast vector tiles | Running complex OLAP queries, Big data, and data lake |
The integration of Geobase and MotherDuck offers several advantages. MotherDuck excels at running OLAP queries, making it ideal for big data analysis. Geobase is particularly strong in handling spatial-temporal queries, crucial for movement analytics in the geospatial industry, and also supports H3 integration for efficient spatial indexing. Combining these capabilities allows API calls through Geobase to MotherDuck. Geobase can also process the data to create vector tiles in response to the frontend, thus allowing visualisation of big data. All this without touching the server!

Drawing an area to see activity in that region
Even more use cases
This integration supports various practical applications, such as real-time maritime activity analysis, global trade insights, and event impact assessment. For example, it can monitor and analyse vessel movements in real-time, track performance at major ports, and evaluate the impact of events like natural disasters or geopolitical conflicts on maritime activities. Of-course the maritime industry is just one of a dozen other industries that create, store & analyse, and build upon geospatial data. These capabilities enable governments, researchers, and businesses to make informed decisions based on comprehensive and timely data.
Conclusion
This is just a highlight of tools from Geobase and MotherDuck which offer much greater possibilities, such as identifying high-density areas, spotting stationary ships, tracking individual ship trajectories, and investigating anomalous ship behaviour.
As we launch geobase we are going to be educating our community on using these tools better and improving the know-how needed to make such powerful applications.